When we were designing Power Pulse, we didn't just pull ideas out of thin air like some kind of EE wizard. We did our homework. We looked at what other people had already built, what worked, what didn't, and where the gaps were. Three projects in particular stood out and honestly shaped a lot of our thinking. Let's get into it.
Project 1: IoT Based Electricity Energy Meter (How2Electronics)
This one is basically the OG reference for the whole project. How2Electronics put together an IoT energy meter using an ESP32 and the Blynk app, and it hits a lot of the same pain points we were trying to solve. The core idea? Nobody wants to walk to a utility box just to read numbers off a meter like it's 1987. Automate it. Send it to your phone. Done.

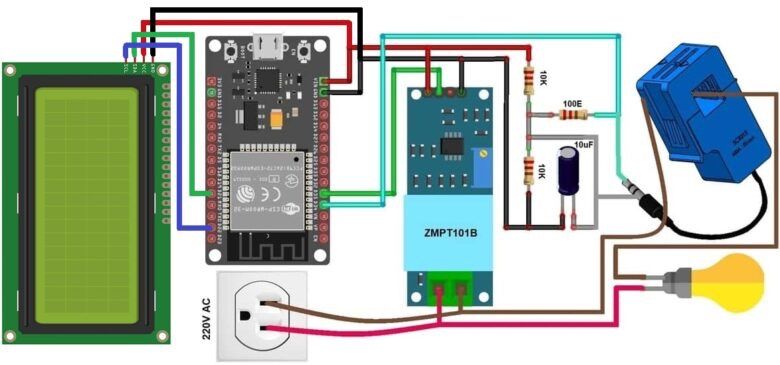
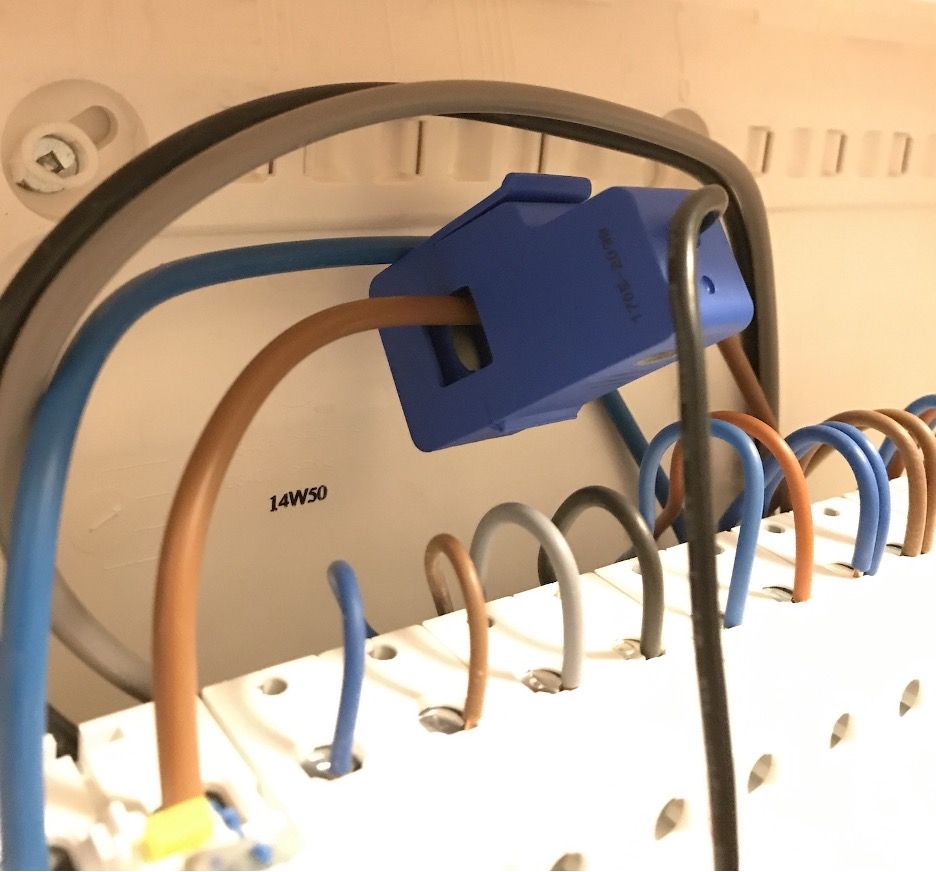
The hardware combo they went with is the SCT-013 Non-Invasive AC Current Sensor paired with the ZMPT101B AC Voltage Sensor. The SCT-013 is a split-core current transformer that clamps right onto a live or neutral wire — no rewiring, no electrician, no drama. It handles up to 30 amps and stays stable up to 70°C. The ZMPT101B handles the voltage side, measuring up to 250V AC with a built-in potentiometer for calibrating the ADC output. Both sensors feed into the ESP32, which processes the data and ships it off to Blynk every 5 seconds.
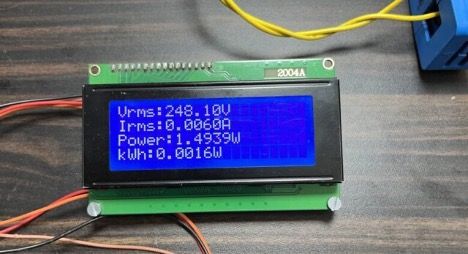
The Blynk dashboard shows voltage, current, power, and kilowatt-hours consumed. They also threw in a 16x2 LCD — though they called it optional, which is giving "we ran out of budget" energy. The circuit itself keeps things clean: sensors connect to the ESP32's Vin pin for 5V power, ground to GND, and outputs to the GPIO pins through a resistor-capacitor filter node (10KΩ, 100Ω, 10µF).
Where it diverges from Power Pulse is the cloud stack. Blynk is doing all the heavy lifting here — it's convenient, sure, but it's a closed ecosystem. Power Pulse is going the AWS and Azure route for cloud ops, and we want a proper visual dashboard, not a serial monitor that looks like it belongs in a 2003 terminal window.
Project 2: IoT Smart Electricity Energy Meter with ESP32 & Blynk 2.0
If Project 1 is the rough draft, this one is the director's cut. Same core components — ESP32, SCT-013, ZMPT101B — but with Blynk 2.0 and an upgraded 20x4 I2C LCD display. The big glow-up here is that the Blynk dashboard is now accessible over the internet instead of just locally. That's a meaningful upgrade.
They also used the ESP32's local memory as a buffer against power outages, which is a smart move. If the connection drops, you're not just losing data into the void. The full parts list is pretty standard: resistors, capacitors, breadboard, micro-USB cable — nothing exotic.
Looking at the circuit diagram, it's nearly identical to Project 1. Same topology, just with the LCD added in. Honestly, I'm like 90% sure this is the same project with a version bump and a better Blynk integration. But that Blynk dashboard — showing real-time data over the web — is genuinely closer to what Power Pulse is going for. We just want it on our own infrastructure, not Blynk's.
Project 3: DIY Home Energy Monitor — ESP32 + CT Sensors + Emonlib
This one goes the hardest of the three and is the biggest influence on Power Pulse by a mile. The developer built this because commercial energy monitors are either expensive or locked behind subscription paywalls — which, fair. The goal was a fully custom, non-invasive energy monitor with cloud storage and a real app to visualize trends.
The hardware is familiar: ESP32, YHDC SCT-013 CT sensor (handles up to 30A, nearly 7000W), LCD display, a protoboard, and 3.5mm headphone jacks to connect the CT sensor cleanly. They even 3D-printed a custom enclosure — a two-piece box with a cutout for the LCD and screws holding it together. That level of polish is rare in DIY projects.
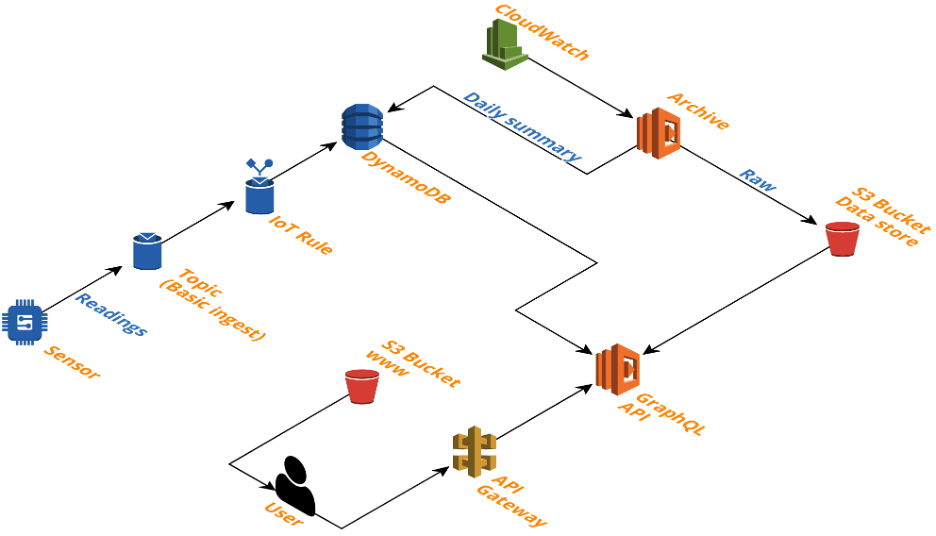
The cloud architecture is where this gets really interesting. They went full AWS — IoT Core receives the data, writes it to DynamoDB, and Lambda functions handle nightly calculations and offload data to S3 buckets every 7 days to keep costs down. The whole thing runs on AWS's free tier. It's serverless, scalable, and costs basically nothing. Sound familiar? That's because Power Pulse is following a very similar cloud playbook.
They also built an API to query data across time ranges and a web app hosted on S3 using Dygraphs for charting. The Ionic mobile app shows real-time consumption, daily usage, standby power, a 30-day history, and even a day/night usage breakdown. The one L they take is that querying data older than 7 days requires jumping through extra hoops since DynamoDB and S3 aren't seamlessly connected in their current setup.
But overall? This project is the closest thing to Power Pulse that exists in the wild. We saw it, took notes, and then asked ourselves how to take it further.